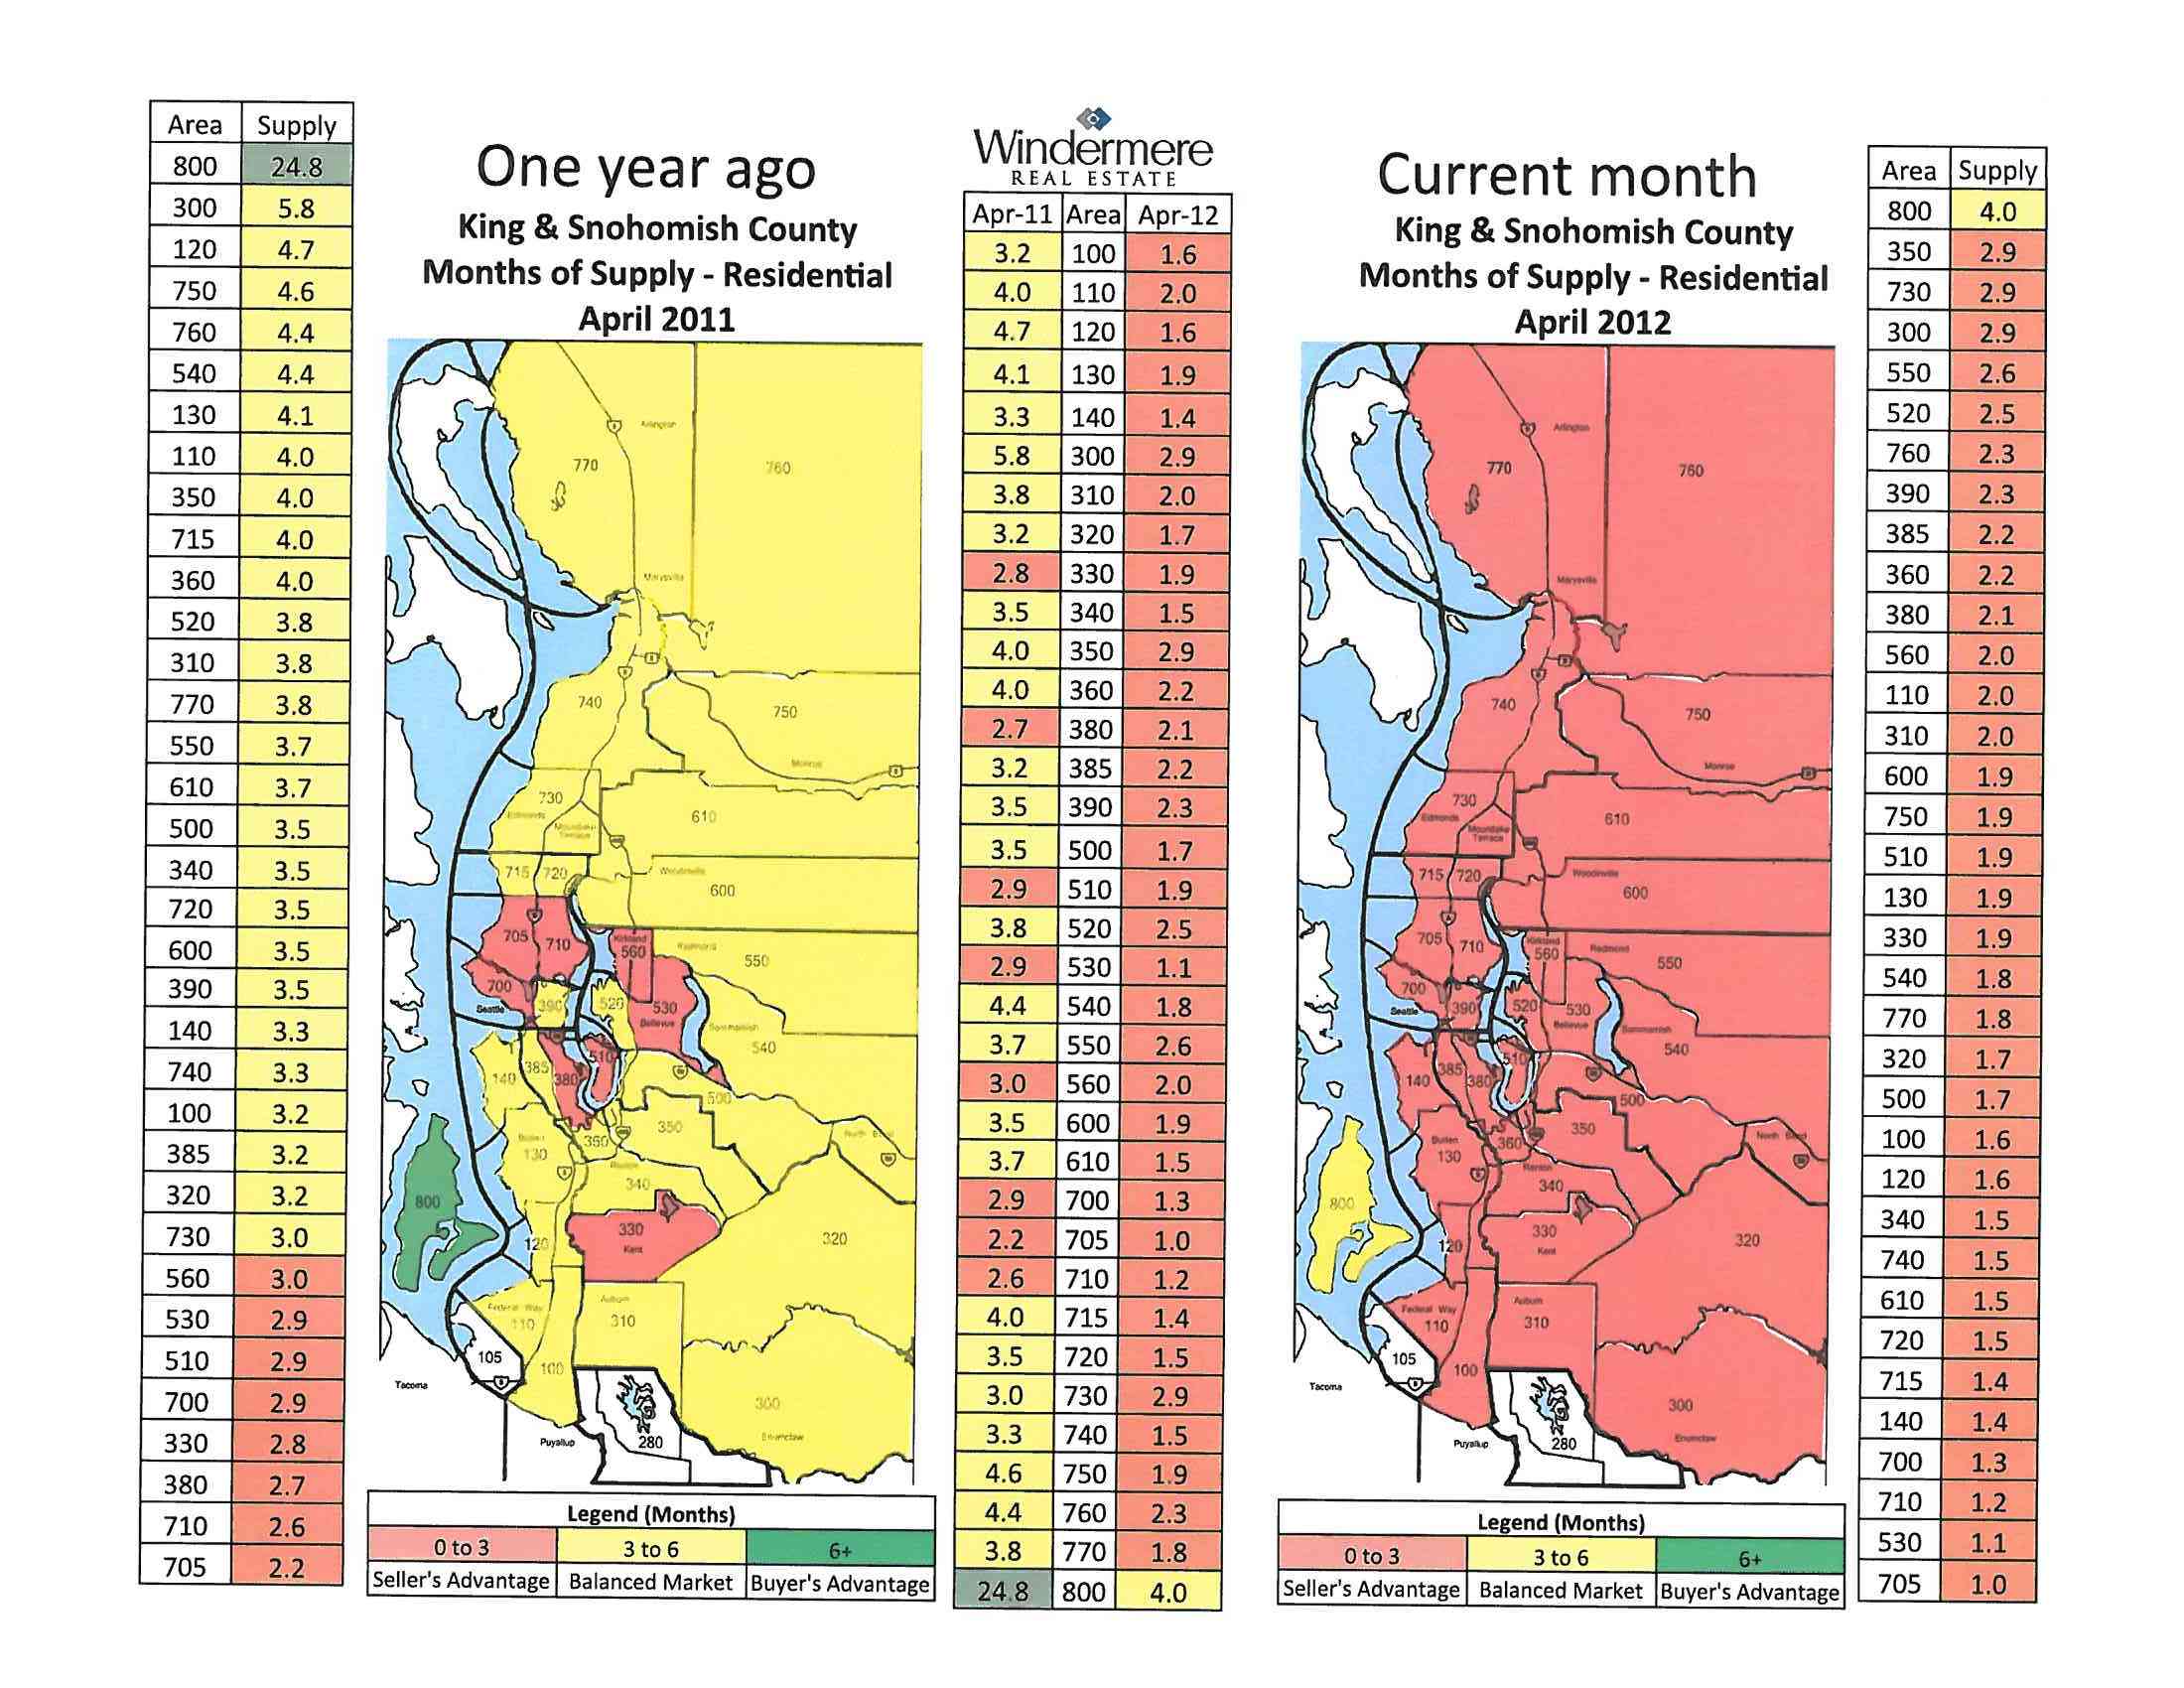
Yellow = 3 to 6 mos of supply of homes for sale on the market. That’s considered a “balanced market.”
Red = 0 to 3 mos of supply. That’s considered a “sellers market.” Prices rise.
Green = 6 or more mos of supply. A “buyers market.” Prices decrease.
Here are the most recent maps, charting April 2011 and April 2012 (wow, what a vivid change!).
Summary: Now very little inventory is available. So you’re experiencing “multiple offers.” When a good home goes up for sale at a reasonable price, buyers jump at it. We think inventory is low in part because quite a few sellers feel “stuck” in their home by how low values went. They’ll wait for prices to rise before they’ll sell.
Here’s Dec. 2009 and Dec. 2008, the depths of the Great Depression, when inventory was very high (sending prices plummeting, as you sorely recall).

